Introduction
This page outlines the methodology behind the SCATTER Inventory and the key data sources and assumptions used. Please refer to the following sections for more information.
- How the inventory works - Background on the frameworks and principles used to calculate the SCATTER inventory.
- Introduction to the sectors - Summary of the emission sectors included in SCATTER.
- Methodology and Sources - Detailed methodology and key data sources are provided for each emissions sub-sector.
- What's changed - Information on updates made to the SCATTER inventory.
How the Inventory works
The inventory is presented according to the Global Covenant of Mayors’ Common Reporting Framework.
The key guidance used to calculate the emissions inventory is The GPC Protocol for Cities. The GPC report is based on the Accounting and Reporting Standard developed by the Greenhouse Gas Protocol, the Global Protocol for Community-Scale Greenhouse Gas Emission Inventories.
The inventory is calculated by applying relevant emission factors to activity data available for local authorities.
Inventory scopes
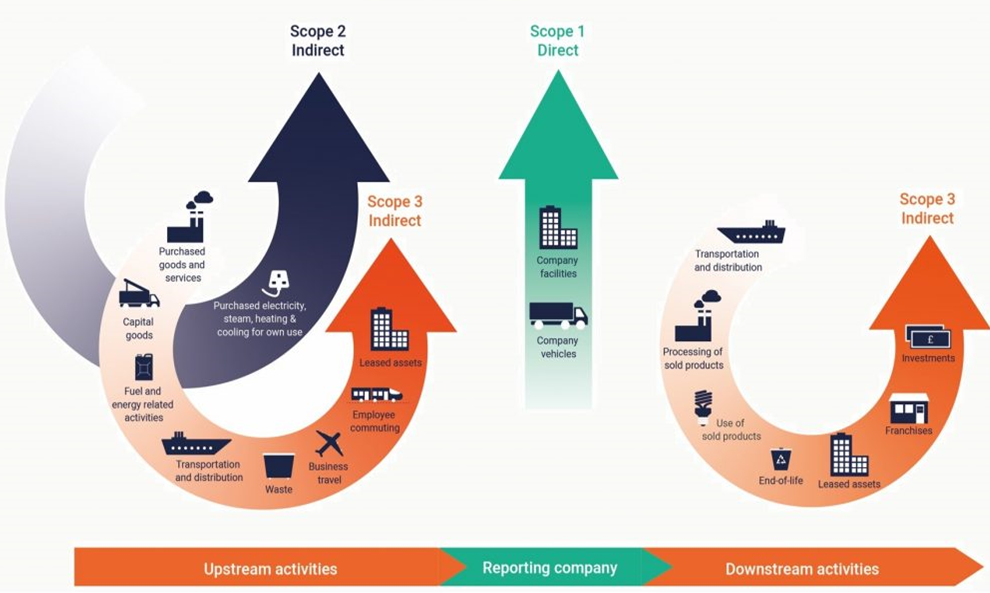
Activities taking place within a city can generate GHG emissions that occur inside the city boundary as well as outside the city boundary. To distinguish among them, emissions are commonly grouped into three categories based on where they occur:
- Scope 1 (Direct emissions)
- GHG emissions from sources located within the city boundary.
- Scope 2 (Indirect emissions)
- GHG emissions occurring as a consequence of the use of grid-supplied electricity, heat, steam and/or cooling within the city boundary.
- Scope 3
- All other GHG emissions that occur outside the city boundary as a result of activities taking place within the city boundary.
Introduction to the sectors
The inventory is made up of six key sectors:
 Stationary Energy
Greenhouse gas emissions are generated in this sector through the combustion of fuel in buildings, manufacturing industries, construction processes and power plants. This includes fugitive emissions. n.b - Fugitive emissions refer to emissions lost due to leakages that occur when extracting, processing and transporting fossil fuels.
- Transportation
This sector produces greenhouse gas emissions through the combustion of fuel or use of electricity during journeys travelled by road, rail, air or water for inter-city and international travel.
- Waste
Disposal and treatment of solid waste and wastewater produces greenhouse gas emissions through incineration, aerobic and anaerobic decomposition.
- Industrial processes and product use (IPPU)
Industrial processes used to physically or chemically transform materials produce greenhouse gas emissions. Also, industries use products that release greenhouse gas emissions throughout its use.
- Agriculture, forestry and other land use (AFOLU)
The AFOLU sector produces greenhouse gas emissions through methane created by livestock, nutrient management for agricultural purposes, and land use change altering soil compositions.
- Energy Generation
Emissions associated with the generation of grid supplied enegry (the production of electricity in boundary). Where applicable, this includes electricity-only generation (from gas, coal, biomass etc), CHP generation, heat/cold generation and local renewable generation.
Methodology and Sources
The methodology and key data sources are described in more detail below for the follwoing sectors:
- Stationary Energy
- Transportation
- Waste
- Industrial processes and product use (IPPU)
- Agriculture, forestry and other land use (AFOLU)
- Energy Generation
Stationary Energy
This sector includes the following sub-sectors:
- Residential buildings
- Commercial building and facilities
- Institutional buildings and facilities
- Industrial buildings and facilities
- Agriculture
- Fugitive emissions
Residential, Commercial, Institutional and Industrial fuel consumption
- Total fuel consumption per Local Authority in this category comes from DESNZ (formerly BEIS) subnational energy consumption by Local Authority. This is allocated to end use using Energy Consumption in the UK (ECUK) 2018 Data Tables which designate energy consumption at a national level, so these divisions are not Local Authority-specific.
- Gas and electricity consumption data for Northern Ireland (Northern Ireland Utility Regulator) was included and apportioned to Local Authorities.
- Domestic energy consumption totals from ECUK Table 3.02: Domestic energy consumption by end use and fuel 1990 to 2017 by fuel are calculated for the different end uses into "space heating & hot water" and "lighting, appliances & cooking".
- Commercial, institutional & industrial energy consumption totals by fuel from ECUK Table 4.04 Industrial final energy consumption by end use (different processes) and Table 5.05a: Final energy consumption in the service sector, by sector and sub-sector, end use and energy source 2017 are calculated for the different end uses into "space heating & hot water" and "lighting, appliances & cooking".
- The share of end use per fuel type was used to divide the domestic fuel consumption data for Domestic and Industrial & Commercial (and “Total” for Bioenergy & Wastes”) into the end uses above. For example, 78% of domestic electricity consumption in ECUK 3.02 was for lighting, appliances and cooking, so we have assumed that for each Local Authority, the electricity consumption reported by DESNZ (formerly BEIS) is 78% for lighting, appliances and cooking.
Domestic space heating and hot water | Domestic lighting, appliances, and cooking | Commercial & institutional space heating, cooling, and hot water | Commercial & institutional lighting, appliances, equipment, and catering |
Space | Lighting | Heating | Fans |
Water | Appliances | Hot Water | Lighting |
| Cooking | Cooling & humidification | Catering |
|
| Cooled Storage | Small Power |
|
| ICT Equipment | |
|
| Other |
Agricultural fuel consumption
- DESNZ (formerly BEIS) Residual fuel use from off-road transportation in the agriculture sector (Sub-national residual fuel consumption data, Residual fuel consumption at regional and local authority level. (2016)) was apportioned to local authorities based on the internal total farmed area (hectares) for England[1], Northern Ireland[2], Scotland[3] and Wales[4].
Fugitive emissions
- Category 1B from the UK Devolved Administration GHG Inventory 1990-2016 Greenhouse Gas Inventories for England, Scotland, Wales & Northern Ireland: 1990-2018, representing fugitive fuel emissions from energy supply is applied to Local Authorities according to their population.
[1] Structure of the agricultural industry in England and the UK at June, English geographical breakdowns, local authority. https://www.gov.uk/government/statistical-data-sets/structure-of-the-agricultural-industry-in-england-and-the-uk-at-june.
[2] Northern Ireland Farm Census - LGD2014, 2013-2016 https://data.gov.uk/dataset/2a936744-dd04-457d-99b5-0000450af4fb/farm-census.
[3] Number of holdings with crops and grass and area of crops and grass by regional grouping and region, June 2001 and 2016 https://webarchive.nrscotland.gov.uk/3000/https://www.gov.scot/Topics/Statistics/Browse/Agriculture-Fisheries/PubEconomicReport/TimeSeries/ERSAC4.
[4] Agricultural small area statistics: 2002 to 2017 https://gov.wales/agricultural-small-area-statistics-2002-2017.
Transportation
This sector produces greenhouse gas emissions through the combustion of fuel or use of electricity during journeys travelled by road, rail, air or water for inter-city and international travel. This sector includes the following sub-sectors:
- On-road
- Rail
- Waterborne navigation
- Aviation
- Off-road
On-road transportation
- Consumption (GWh per Local Authority) is taken directly from the data for total final energy consumption at regional and local authority level published by DESNZ (formerly BEIS) (Subnational energy consumption by Local Authority). Fuel is assumed to be diesel, with a small amount of coal consumed by rail in some sectors. This is a top-down method – guidance on the pros and cons of transportation methodologies is described in table 7.3 of the GPC protocol guidelines.
Rail transportation
- Consumption (GWh per Local Authority) is taken directly from the data for total final energy consumption at regional and local authority level published by DESNZ (formerly BEIS) (Subnational energy consumption by Local Authority). Fuel is assumed to be diesel, with a small amount of coal consumed by rail in some sectors. This is a top-down method – guidance on the pros and cons of transportation methodologies is described in table 7.3 of the GPC protocol guidelines.
- It is not possible to separate electricity consumed by the railways and by electric vehicles from that consumed by other commercial and industrial activities in the DESNZ (formerly BEIS) dataset. It is not possible to report all rail and road emissions as a separate sub-sector within the transport sector. Instead emissions attributable to electricity consumption in the rail sector are included in the commercial and industrial sector, and only diesel emissions are shown as a separate sub-sector.
Waterborne transportation
- Local-level fuel consumption from waterborne transportation was calculated based on UK total fuel consumption from National Navigation, derived from the Digest of UK Energy Statistics DUKES 1.1 Aggregate energy balance 2018. “National Navigation” is defined as Fuel oil and gas/diesel oil delivered, other than under international bunker contracts, for fishing vessels, UK oil and gas exploration and production, coastal and inland shipping and for use in ports and harbours.
- Total fuel consumption from inland waters traffic is divided into internal and coastal using Department for Transport Statistics Domestic Waterborne Freight Statistics table PORT0701 (b) Waterborne transport within the United Kingdom by cargo category, goods moved (billion tonne-kilometres).
- Inland transport is allocated to LA using the proxy of km canal length. Canal coverage of England and Wales from the Canal & River Trust for England and Wales was mapped onto the LA geographic boundaries. You can see a visualization of canal coverage for England and Wales here. This dataset does not cover Scotland and Northern Ireland, but table PORT0703 from the DfT Statistics was used to confirm that no major inland transport has been recorded for Scotland or Northern Ireland for 2018.
- Table PORT0101 - All UK major and minor port freight traffic, by port and year (direction filter) from 1965 - was used to tag port locations to Local Authority.
Aviation
- Data for aviation emissions was extracted from the Greenhouse Gas Inventories for England, Scotland, Wales & Northern Ireland: 1990-2018, Categories 1A3a and Aviation Bunkers for England, Wales, Scotland and Northern Ireland for Aviation Spirit and Aviation Turbine Fuel. This gave total emissions for landing and take-off (LTO) and Cruise phases of UK flights. A percentage of total aircraft movements for each UK airport was calculated from the Civil Aviation Authority (CAA) 2017 dataset Table_05_Air_Transport_Movements, Airport data 2018, Civil Aviation Authority.
- Scope 1 emissions: LTO emissions are used as a proxy for flights that take off and land within the boundary of the local authority area. The disadvantage of this methodology is that LTO actually relates to flights that do not start and end in boundary (i.e. are not considered scope 1 according to the GPC methodology). Here it is used as a proxy to represent emissions relating in-boundary flights e.g. police helicopters/’grass strip’ flights that fall under this category, which do take off and land in-boundary.
- LTO emissions have been allocated to UK airports based on the percentage of total aircraft movements. Airport names have been manually matched to individual local authority codes in the Civil Aviation Authority air transport movements dataset. LTO tonnes of fuel were calculated from the total impacts using DESNZ (formerly BEIS) fuel emission factors. LTO impacts are reported as Scope 1 aviation.
- Scope 3 emissions: Cruise impacts were allocated to LAs based on percentage of population, assuming that flying is uniformly distributed across the whole population. Cruise tonnes of fuel were calculated from the total impacts using DESNZ (formerly BEIS) fuel emission factors. Cruise impacts are reported as Scope 3 aviation.
Off-road transportation
- A base assumption of 1% of total on-road fuel consumption (DESNZ (formerly BEIS) final energy consumption by Local Authority)[1] apportioned to off-road.
[1]Total final energy consumption at regional and local authority level; Department for Energy Security & Net Zero, Sub-national total final energy consumption data (2016)
Waste
Disposal and treatment of solid waste and wastewater produces greenhouse gas emissions through incineration, aerobic and anaerobic decomposition.
This sector includes the following sub-sectors:
- Solid waste disposal
- Biological treatment
- Incineration and open burning
- Wastewater
Municipal waste
- Commercial & industrial, business, and municipal waste statistics by local authority were combined from country-specific sources and online data portals, and where relevant combined and/or waste authority averages were applied to individual local authorities. These have been allocated to different streams (open-loop, closed-loop, landfill, composting, incineration).
- Sources of waste data are summarized below:
- England Municipal waste: Department for Enviornment, Food & Rural Affairs. ENV18 - Local authority collected waste: annual results tables.The dataset has been checked for any local authority exclusions, whereby, averages have been taken for local authorities in County Councils and Metropolitan Borough Councils.
- Northern Ireland Municipal waste: Department of Agriculture, Environment and Rural Affairs. Northern Ireland local authority collected municpal waste management statistics 2017/18 annual report.
- Scotland:
- Scottish Environment Protection Agency, 2018. Business waste data. Business waste data 2018. [Online] Available at: https://www.sepa.org.uk/environment/waste/waste-data/waste-data-reporting/business-waste-data/.
- Scottish Environment Protection Agency, 2018. Household waste data. Household waste summary data, 2018. [Online] Available at: https://www.sepa.org.uk/environment/waste/waste-data/waste-data-reporting/household-waste-data.
- Scotland’s Environment, 2018. Scotland’s Environment Waste Discover Data tool. Management subcategory: Waste management (tonnes). [Online] Available at: https://www.environment.gov.scot/data/data-analysis/waste-from-all-sources/.
- Wales:
- Rolling 12 month period of combined municipal reuse/recycling/composting rates by local authority, April 2018-March 2019. The individual data exports (i.e. waste tonnages by variable) from the Stats Wales online data tool were compiled into a master local authority waste dataset.
- Data was classified into waste streams according to the below table:
Waste Type | Conversion Factors 2018, Description |
Re-use | Materials that are re-used instead of disposed of by recycling or landfill. |
Open-loop | Open-loop recycling is the process of recycling material into other products. |
Closed-loop | Closed-loop recycling is the process of recycling material back into the same product. |
Combustion | Energy is recovered from the waste through incineration and subsequent generation of electricity. |
Composting | CO2e emitted as a result of composting a waste stream. |
Landfill | n/a |
Anaerobic Digestion | n/a |
Wastewater
- Wastewater treated has been calculated for the national total wastewater based on emissions and emissions factors used for the UK Devolved Administration GHG Inventory 1990-2018. This has been applied to local authorities based on population.
- NMVOC emissions from municipal wastewater treatment (WWT) plants are estimated using the Tier 1 method given in the 2016 EMEP/EEA Guidebook. The approach uses the default emission factor (15 mg NMVOC/m3 wastewater handled) and activity data estimates based on a time series of waste water generated from residential properties for treatment from the UK water companies (UK Informative Inventory Report (1990 to 2018).
Industrial processes and product use (IPPU)
This sector includes the following sub-sectors:
- Industrial Process
- Product Use
Industrial Processes
- Fuel consumption share per LA calculated as the industrial & commercial fuel consumption per fuel and per LA divided by the total fuel consumption from DESNZ (formerly BEIS) (Total final energy consumption at regional and local authority level, 2005:2018).
- Total DUKES industrial fuel & electricity apportioned to LA using the proportions calculated in step (1), per fuel type and per industrial area (as defined in DUKES 5.1 Electricity: commodity balances (2018) and DUKES 1.1 Aggregate energy balance 2019; DUKES_1.1-1.3, for Iron and steel, Non-ferrous metals, Mineral products, Chemicals.
- Emissions derived from the total UK GHG emissions by source for Industrial Processes (Greenhouse Gas Inventories for England, Scotland, Wales & Northern Ireland: 1990-2018) were calculated per LA according to emissions factors calculated in per kWh fuel consumption per industry type. The England, Wales, Scotland and Northern Ireland datasets were filtered for Industrial Processes, and the list of processes covered was mapped to the industry types in the DUKES energy consumption data.
- CHANGES: During the preparation for the Beta testing for SCATTER Pathways, a mistake was spotted in the emissions factors, impacting IPPU emissions. The emissions factors affected are:
- Industrial Processes_Other industry
- Industrial Processes_Non-ferrous metals
- Industrial Processes_Mineral products
- Industrial Processes_Iron and steel
- Industrial Processes_Chemicals
Agriculture, forestry and other land use (AFOLU)
The AFOLU sector produces greenhouse gas emissions through methane created by livestock, nutrient management for agricultural purposes, and land use change altering soil compositions. Agricultural data for livestock including the total number of dairy cattle, non-dairy cattle, sheep, pigs, horses and poultry by local authority for England, Scotland, Wales and Northern Ireland was amalgamated, and where no individual local authority data was readily available combined authority averages were applied.
- Livestock
- Land use
- Other AFOLU
Livestock
- Livestock numbers across England, Northern Ireland, Scotland and Wales were derived from the following datasets:
- England: Structure of the agricultural industry in England and the UK at June, English geographical breakdowns, local authority.; Department for Environment, Food & Rural Affairs (2016); ENGLAND COW NUMBERS BY COUNTY; Agriculture & Horticulture Development Board (2016) Please note that this data set groups some local authorities together therefore livestock data was apportioned to each local authority from the group level. This was done by dividing livestock figures by the number of local authorities in the group, meaning some urban local authorities may see livestock emissions that are not relevant.
- Northern Ireland: Cattle populations in Northern Ireland from 1981 to 2019; Farm Census - LGD2014, 2013-2019
- Scotland: ERSA C10 (ii) Number of livestock by regional grouping and region June 2001 and 2017;
- Wales:Agricultural small area statistics: 2002 to 2018; Welsh Government (2019).
- Where numbers of cows are not given in dairy / non-dairy these have been apportioned based on:
- England - England Cow Numbers by County published by the Agriculture & Horticulture Development Board.
- Northern Ireland - Cattle populations in Northern Ireland from 1981 to 2018, published by the Northern Ireland Department of Agriculture, Environment and Rural Affairs.
- Scotland - Scottish Agricultural Census Table 3. Number of cattle, 2007 to 2019: Data obtained from Cattle Tracing Scheme.
- Emissions factors for livestock are UK averages, based on the UK Greenhouse Gas Inventory, 1990 to 2017, Sectoral background data for agriculture. Emissions sources and what is included are summarized below:
Greenhouse gas | Sources | What is included?* |
Methane emissions per head: | TABLE 3.A - Enteric Fermentation ; TABLE 3.B(a) - CH4 Emissions from Manure Management | Enteric fermentation (direct CH4 emissions from burping and farting); CH4 emissions from manure storage |
Nitrous Oxide emissions per head | TABLE 3.B(b) - N2O Emissions from Manure Management | Direct N2O emissions from manure management when housed |
*Not included in N2O emissions are:
- N2O emissions from manure dropped on the land by livestock when grazing (2% to 6% additional for cattle, 60% additional for poultry).
- N2O emissions from manure collected then spread on the land (7% to 10% additional for cattle, to >100% additional for poultry).
- CHANGES: The emissions factors used for livestock in the Pathways for CH4 and N2O have been amended to give the correct conversion to CO2e from their raw factors. Emissions factors affected (22/05/2020):
- Dairy Cattle; Deer; Goats; Horses; Non-dairy cattle; Poultry; Sheep; Swine
Land use
- Only CO2 emissions from land use are included; these come directly from the UK LACO2 dataset 2005 to 2016 UK local and regional CO2 emissions – data tables; Department for Energy Security & Net Zero, 2005 to 2016 UK local and regional CO2 emissions – data tables (2016).
Energy Generation
This sector includes the following sub-sectors:
- Electricity-only generation
- CHP generation
- Heat/cold generation (NE)
- Local renewable generation
Power stations in the UK (Digest of UK Energy Statistics Chapter 5: statistics on electricity) tables 5.10 & 5.11 have been allocated to Local Authorities, and the plant installed capacity (MW) from DUKES 5.11 has been converted to kWh and multiplied by respective load factors for different fuel types derived from DUKES Chapter 6: renewable sources of energy table 6.5 (Load factors for renewable electricity generation), or DUKES 5.10 to derive electricity-only generation. The same methodology was also adopted for large-scale local renewable generation, however, load factors for different renewable technologies were derived from DUKES 6.5. Small-scale local renewable generation including, Solar PV, Onshore Wind, Hydro, Anaerobic Digestion, Offshore Wind, Wave/Tidal, Sewage Gas, Landfill Gas, Municipal Solid Waste, Animal Biomass, Plant Biomass and Cofiring, was taken directly from the DESNZ (formerly BEIS) Renewable Electricity by Local Authority (MWh) 2014-2019 dataset (Department for Energy Security & Net Zero, Renewable electricity by local authority: Renewable electricity generation: (MWh) at Local Authority Level - 2019).
Large scale CHP schemes from DUKES Chapter 7: combined heat and power table 7.10, Large scale CHP schemes in the United Kingdom, operational at the end of December 2018, have been allocated to Local Authorities, whereby an average fuel consumption value based on scheme installed capacity from DUKES 7.2, Fuel used to generate electricity and heat in CHP installations, was applied.
What's changed?
We have recently added in functionality to allow you to access previous years’ inventories on the SCATTER website, so you are now able to download 2017, 2018 and 2019 inventories. Previous inventories have not been retrospectively updated where methodology has changed and remain as they were when originally released. Significant updates in our method are flagged on this page in red.
How to understand year-on-year changes
If you would like to further understand the drivers for changes in emissions values in your inventory, please review the emissions factors, activity data and change log provided in the Inventory Download. Changes to data year-on-year could be as a result of several changes including:
- Activity data: SCATTER uses underlying activity data (e.g. kWh of energy use, tonnes of waste collected) to calculate emissions. You can find the underlying data for any dataset in the inventory download Full Table tab. This activity data may change year on year due to:
- Activity data method changes: It may be the case that changes in activity data arise due to the method of sourcing, calculating, estimating or segmenting data changing over time. Where possible we have identified this in the data changes tabs. However, there may be other changes or impacts on specific areas not recorded here in some situations.
- Activity data changes: Activity data itself could change from one year to another due to local changes.
- We recommend looking at the activity data specific to your authority and viewing the method notes provided by the publisher of activity data if you have queries about specific elements of your inventory.
- Emissions factors: A carbon factor (kgCO2e per activity data unit) is applied to the activity data and this may also change year on year, resulting in a change in emissions. You can find details of the emissions factors used each year and data sources in your inventory download in the Full Table and Emissions Factors tabs. The reasons the emissions factors may change year on year are similar to those outlined above.
- Emission factors method changes: There may been a change in the method of sourcing, calculating or estimating emissions factors. It is recommended to review the source of emission factor data to understand the methodology for calculation.
- Emission factor changes: The factors themselves may change year on year because of national grid factor changes, the decarbonisation of a sector or other wider changes.
- SCATTER method changes: Any updates to our SCATTER inventory calculation that have taken place are all recorded in the change log on the Intro tab and on the Inventory Methodology page on the SCATTER website.